
Performance Insights
On this page
This guide explains how to track and analyze campaign performance using Performance Spotlight and Channels Performance sections. It covers identifying top-performing campaigns, comparing metrics, and using insights to optimize channel strategies. The Account Summary provides a consolidated view of all data to streamline decision-making.
Welcome to the Performance tab, where you can track your marketing efforts in five main sections: Performance Spotlight, Channels Leaderboards, Channels Performance, Targeted Recommendations and AI Knowledge Hub.
For now, we'll focus on the Performance Spotlight, and Channels Performance tabs. If you’d like to learn more about General Analysis, Deep Analysis, Channels Leaderboard, Targeted Recommendations and the AI Knowledge Hub, simply click on their respective links.
Performance Spotlight
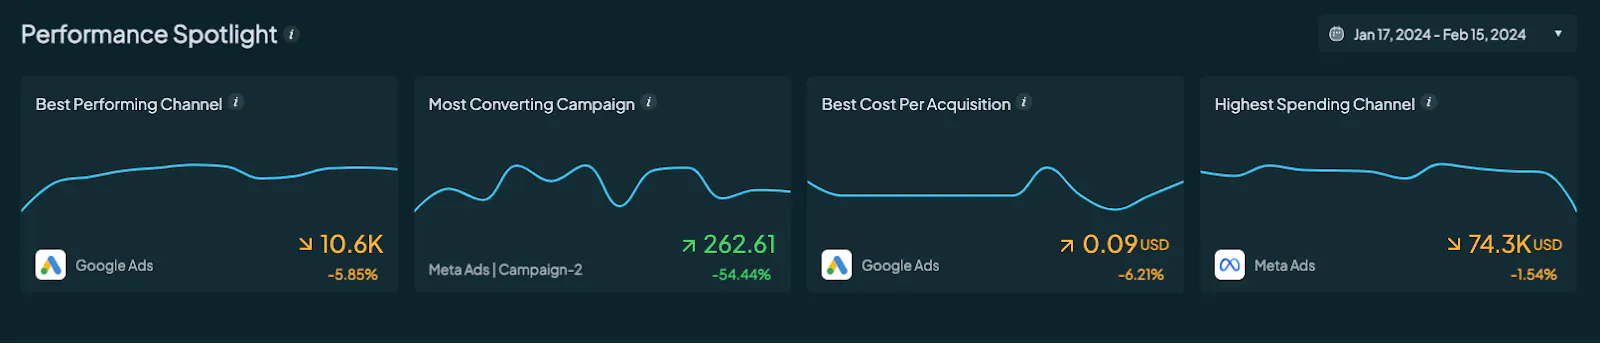
In the Performance Spotlight section, you'll get a quick overview of key performance metrics for your selected time period. This includes insights into your campaigns, groups, and channels with top Return on Ad Spend (ROAS), conversions, and spending.
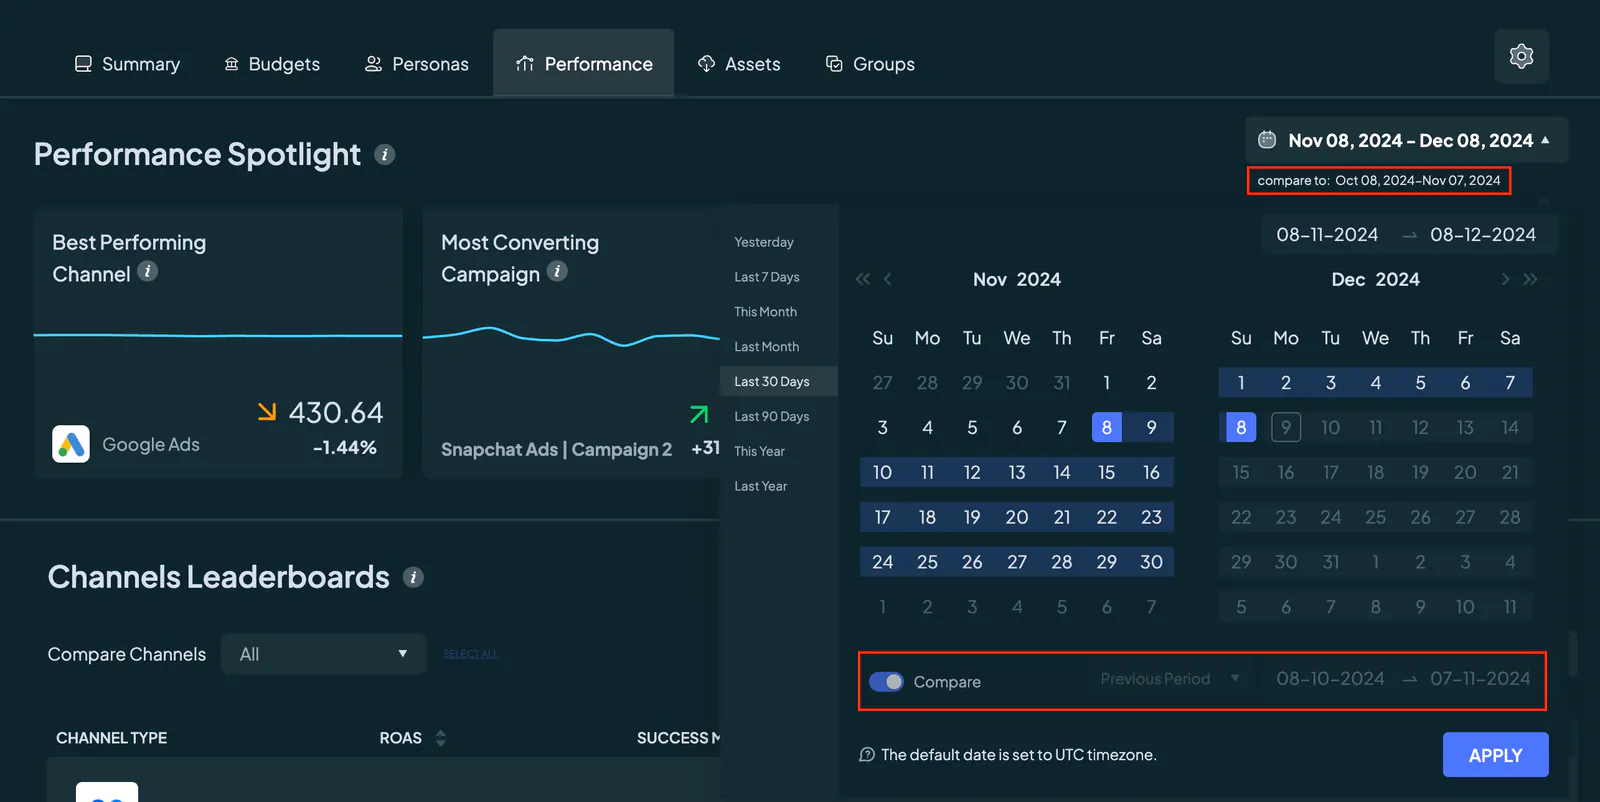
To customize your view, use the date picker, which includes a powerful comparison feature. Simply toggle the "Compare" button to enable the second date range. By default, it compares the current period with the previous one. If you prefer, you can select the custom date option to pick your own comparison date range.
Now, let's dive into the four important insights provided in the Performance Spotlight:
- Best Performing Channel: This highlights the channel with the highest Return on Ad Spend (ROAS) for a specific date. A high ROAS is good because it means you're getting more return or profit from your marketing investment. Conversely, a low ROAS indicates that you're not getting enough return for the money you're spending on that channel.
- Most Converting Campaign: This showcases the campaign with the highest number of conversions within a specific date range. Having a high number of conversions is beneficial because it means more users are taking desired actions, such as making a purchase or signing up. Conversely, a low number of conversions suggests that your campaign may not be effectively driving user actions.
- Best Cost Per Acquisition: This identifies the campaign with the lowest Cost per Acquisition (CPA) within a specific date range. A low CPA is desirable because it means you're acquiring customers at a lower cost, maximizing your marketing efficiency. On the other hand, a high CPA indicates that you're spending more to acquire each customer, which can impact your overall profitability.
- Highest Spending Channel: This highlights the channel with the highest amount spent within a specific date range. While spending more on a channel can be beneficial for reaching a larger audience or driving more engagement, excessively high spending without sufficient returns can lead to inefficiencies and reduced profitability. It's important to monitor your spending and ensure it aligns with your ROAS goals and overall marketing strategy.
Channels Performance
In the Channel Performance section, you’ll find a detailed breakdown of every marketing channel and campaign, giving you valuable insights into their effectiveness. This section is essential for assessing the performance of your marketing strategy and identifying opportunities for optimization.
The data available here is channel-dependent, meaning the subtabs and levels displayed—such as Campaigns, Ad Groups, and Ads—will vary based on the channel you select. For example, LinkedIn Ads might display Campaign Groups, Campaigns, and Ads, while Google Ads could show Campaigns, Ad Groups, Ads and Landing Pages.
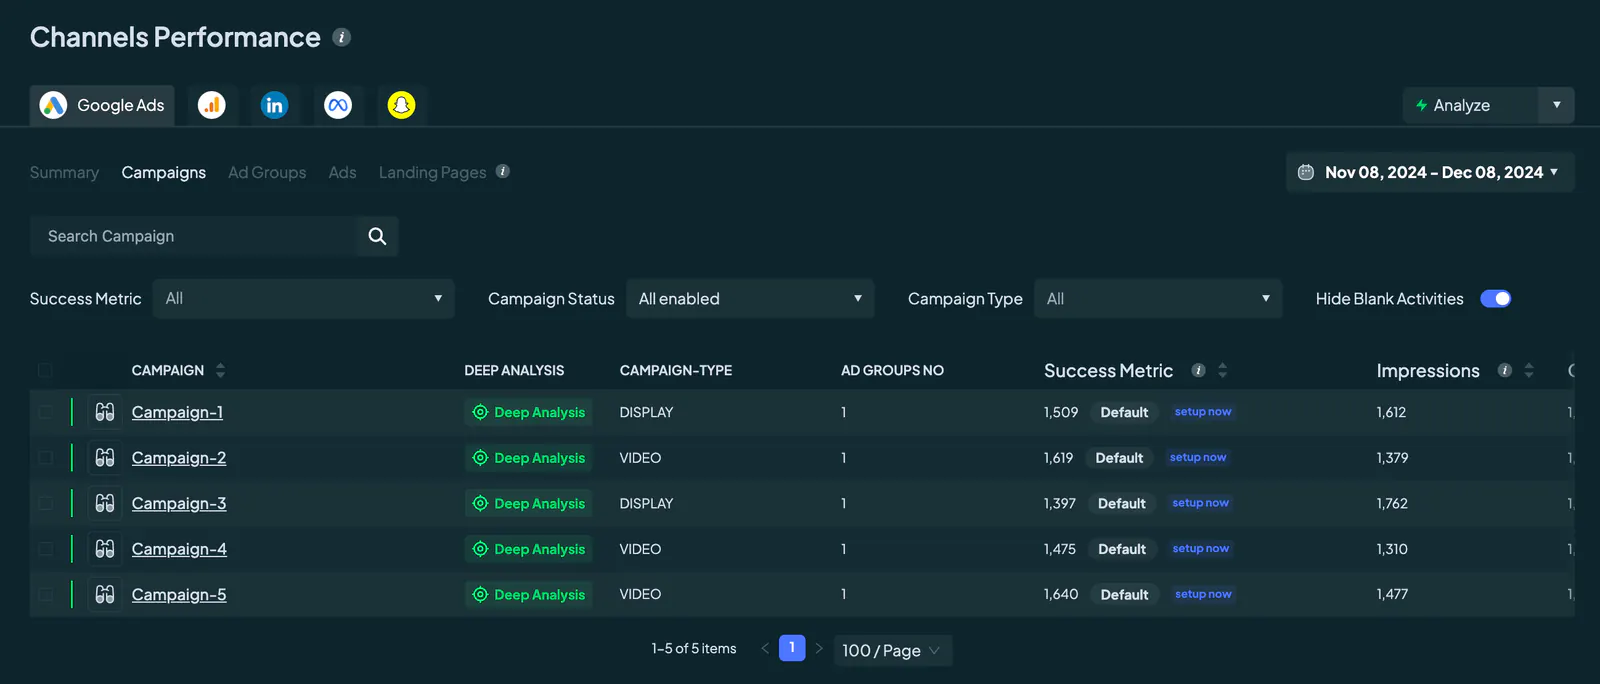
Additionally, the channels displayed in this section are directly tied to the connections you’ve made on the platform. Ensure that you’ve set up and linked your digital channels in the Data Connections section to access comprehensive metrics for those accounts.
A Quick View feature is available across all levels, including Campaigns, Ad Groups, Ads, and Landing Pages. You can access the Quick View by clicking the binoculars icon next to any entry.
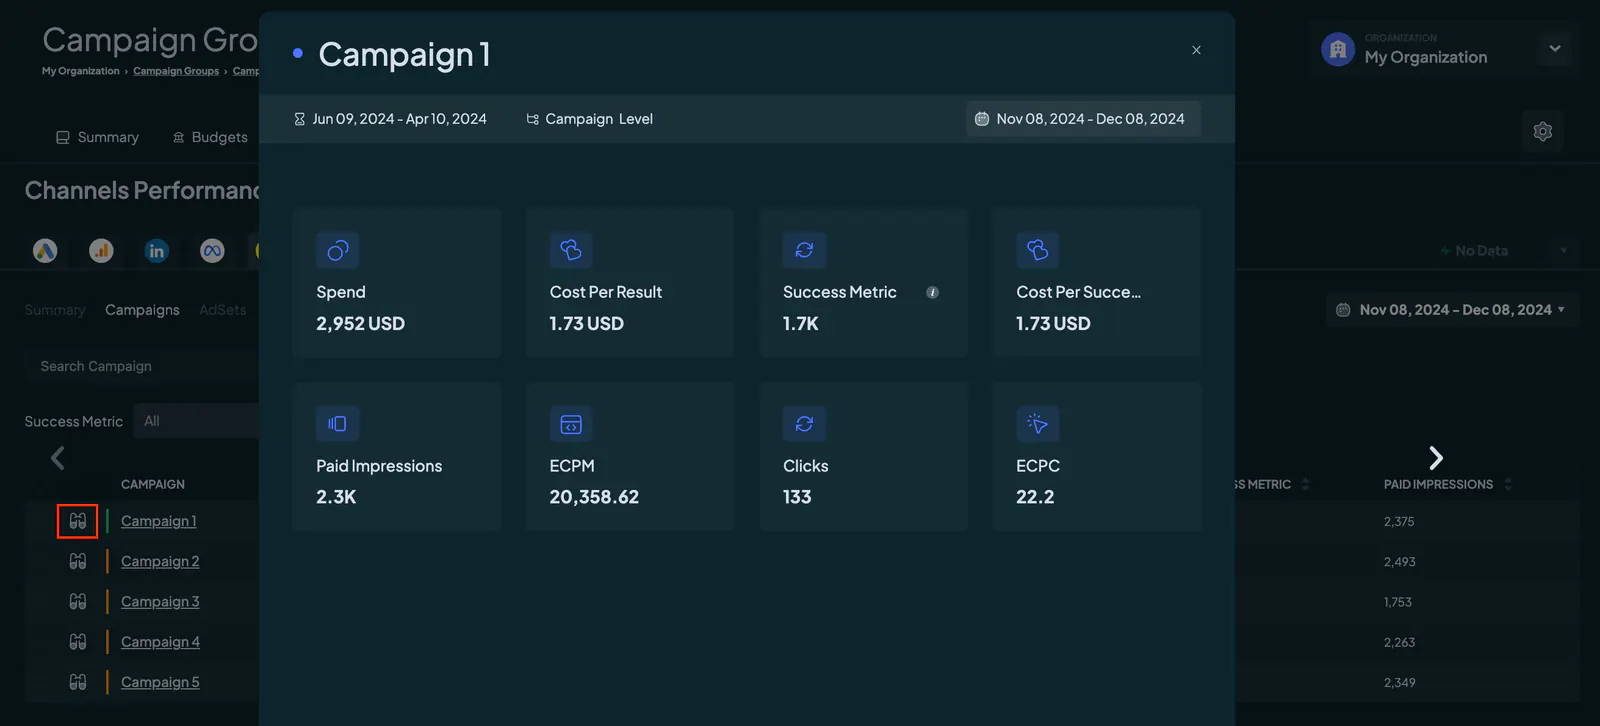
This opens a detailed popup displaying key metrics, such as spend, cost per result, impressions, clicks, and other performance indicators for the selected entity.
In addition to these levels, there is an Account Summary level, which consolidates data from all campaigns into a single, high-level view for a complete performance overview.
Account Summary
The Summary tab aggregates the data from all joined campaigns into one view, providing a high-level overview of your marketing account.
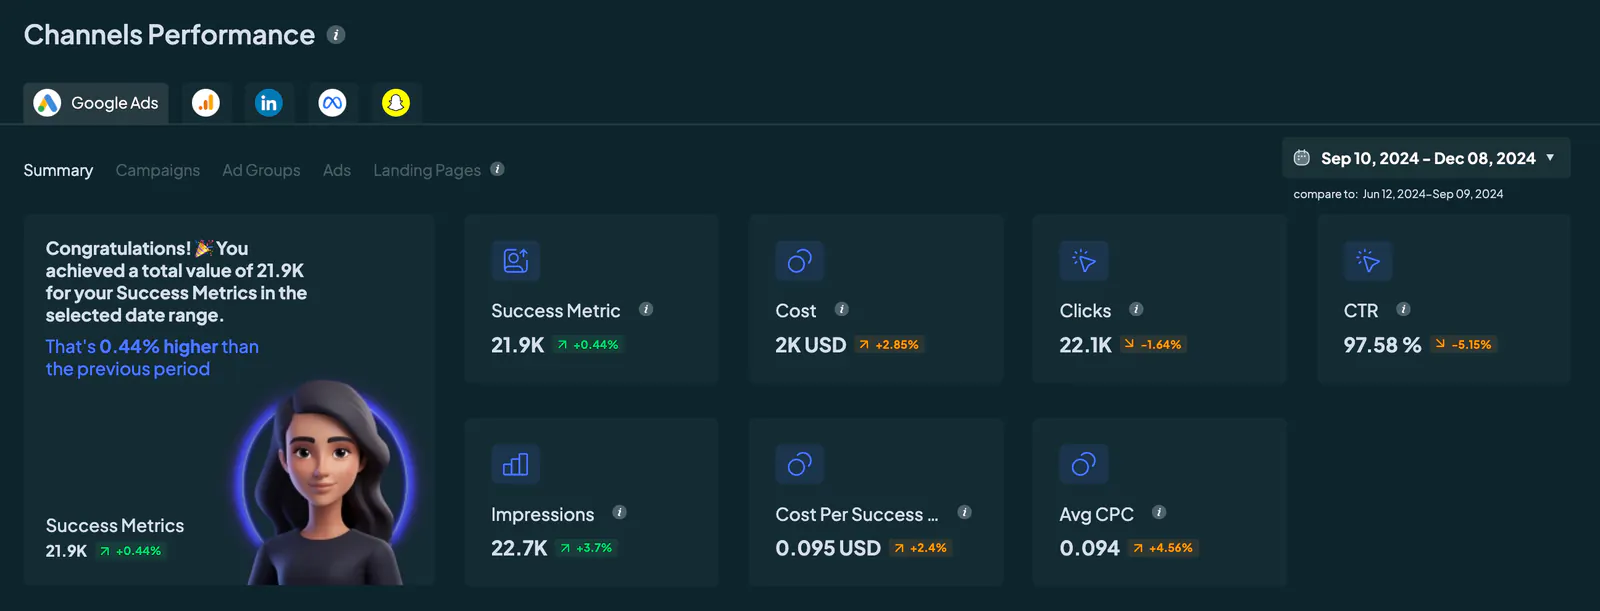
It includes key metrics like total engagements, conversions, and performance indicators, giving you a quick snapshot of overall account health.
Campaigns
Dive deeper into individual campaigns to see how they're performing. You'll find metrics related to engagement, conversions, and other relevant data to assess the success of each campaign. This tab helps you evaluate the effectiveness of your campaign strategies and identify areas for optimization.
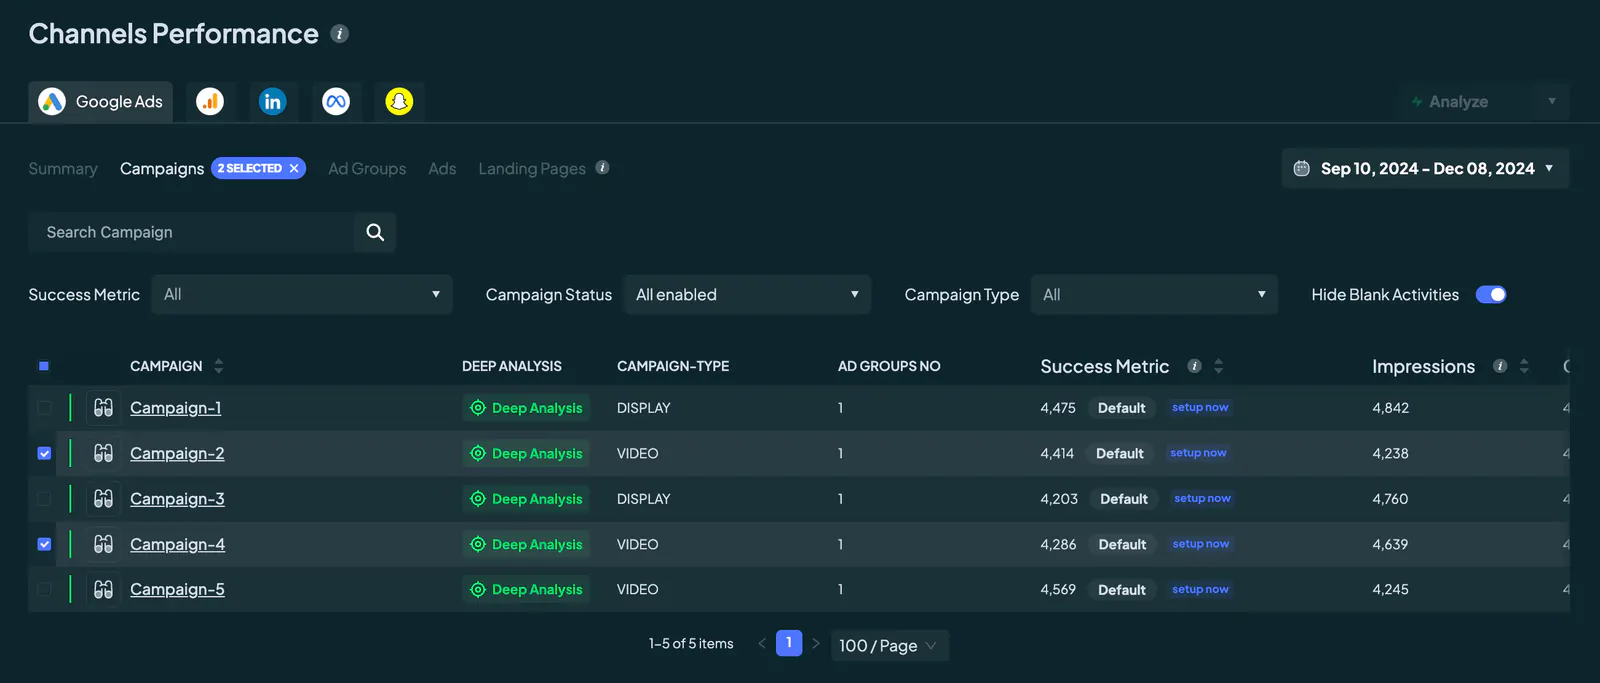
Choose a specific campaign or multiple campaigns, and upon navigating to any other section, the table will only show the ad groups associated with your selected campaigns.
The snapshot view (the binoculars icon) of the campaign was developed to provide a more specific focus. In the event that a fixation on a certain campaign is required, it offers all the campaign's important metrics in a more expanded and individualistic view.
Ad Groups
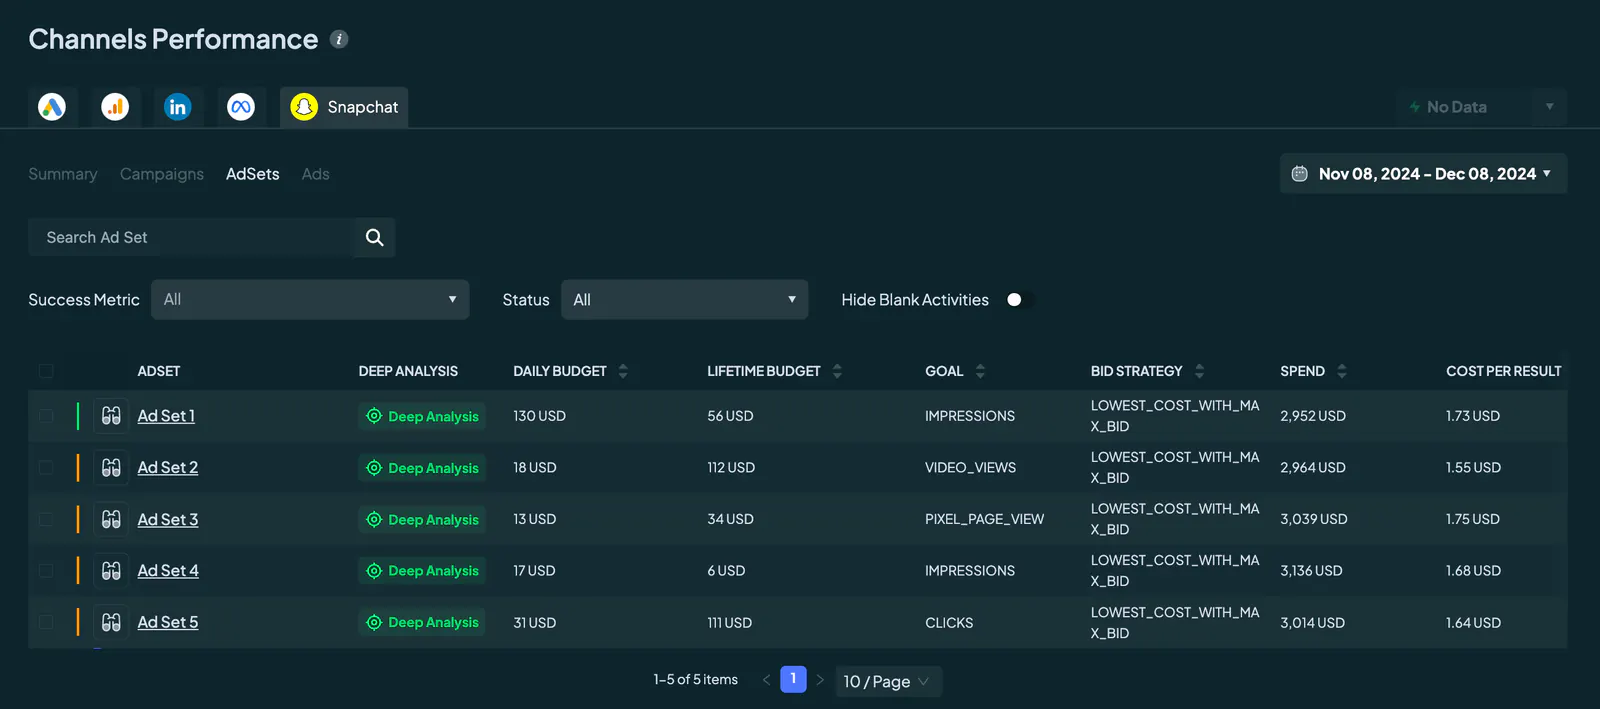
Explore the performance of your ad groups within each campaign. This tab provides insights into the effectiveness of different ad groupings, helping you refine your targeting and messaging strategies for better results.
Ads
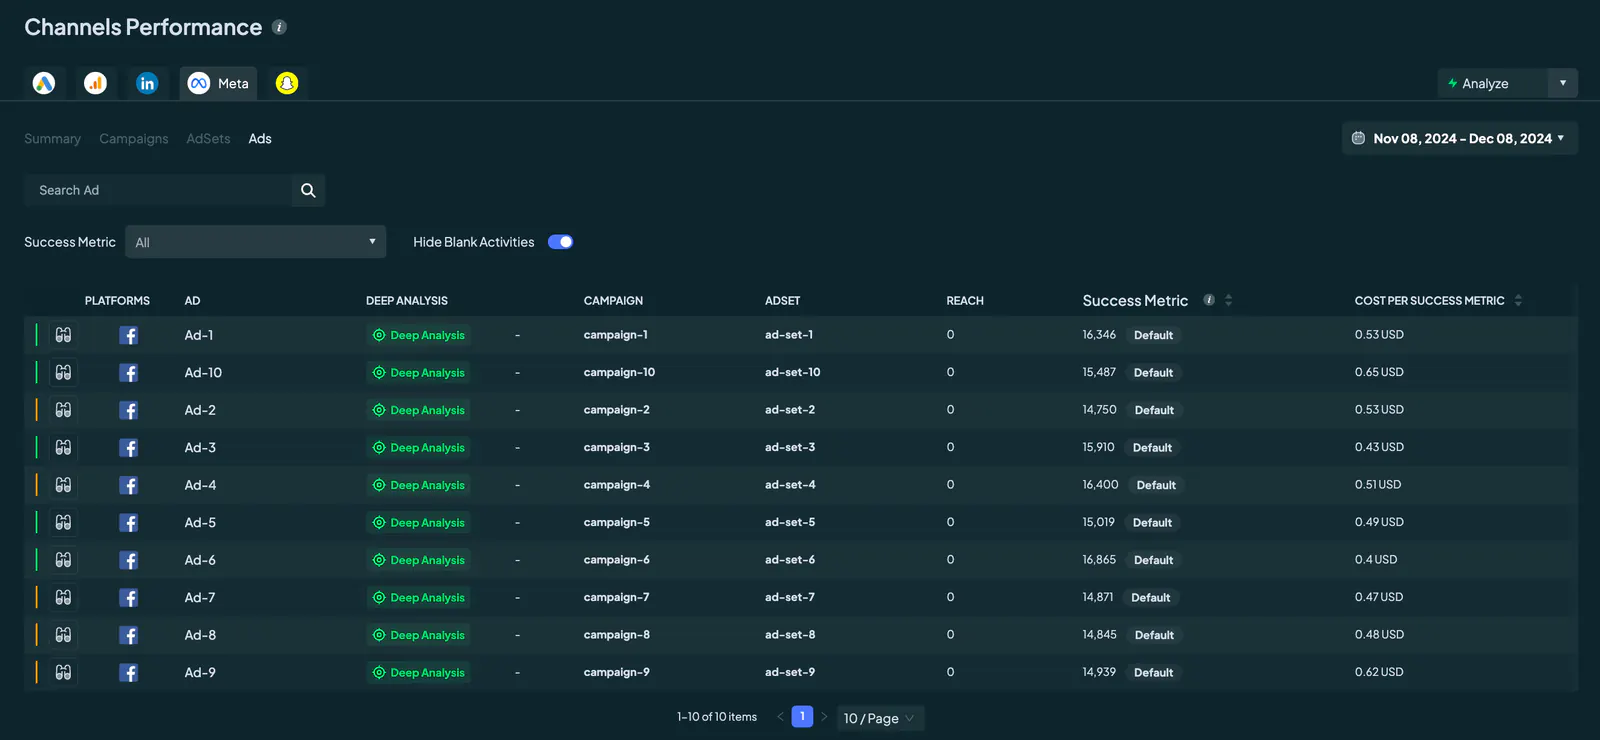
Review the performance of your individual ads to see which ones are driving the most engagement and conversions. This tab allows you to assess the effectiveness of your ad creatives and make adjustments as needed to maximize results.
Landing Pages
Landing pages are specific to Google Ads. This tab gives you a performance breakdown for the pages you're sending traffic to from your ads.
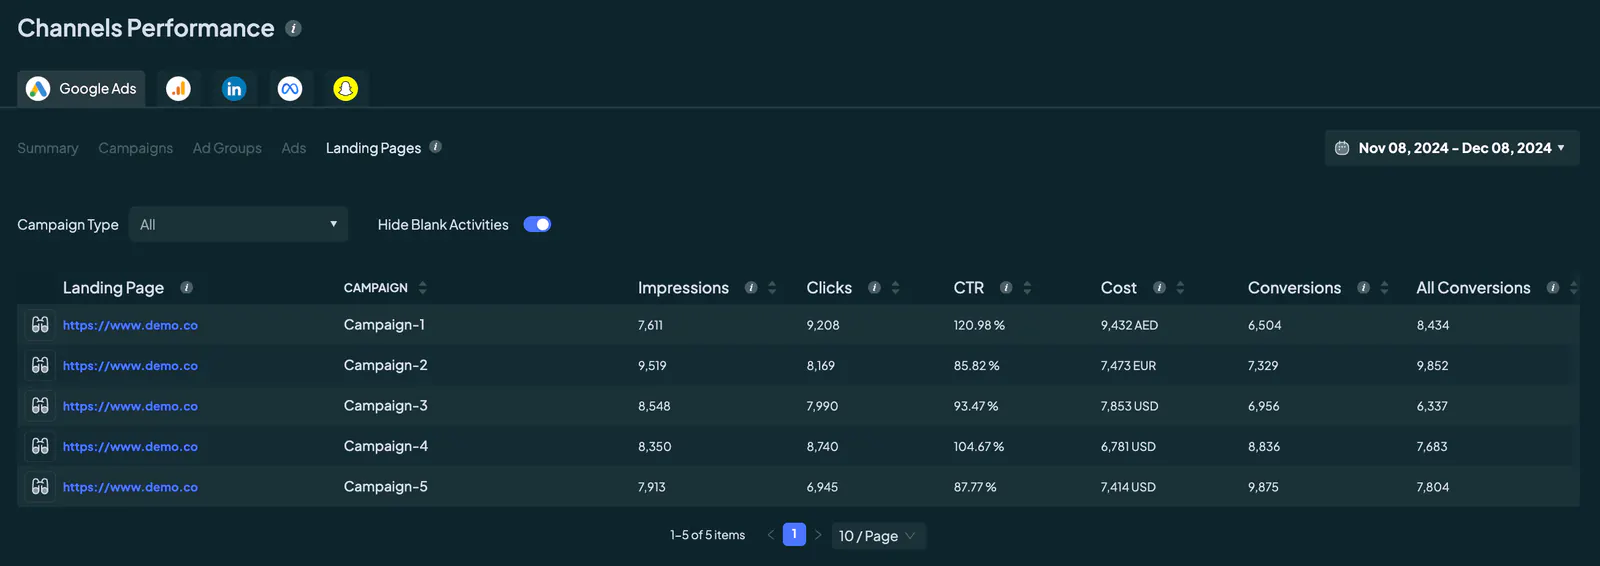
Analyze the performance of your landing pages to understand how they're impacting conversions and engagement. This tab provides insights into which landing pages are most effective at driving user actions, helping you optimize your website for better results.